from siuba import _, group_by, summarize
from siuba.data import mtcars

(mtcars
  >> group_by(_.cyl)
  >> summarize(avg_hp = _.hp.mean())
)| cyl | avg_hp | |
|---|---|---|
| 0 | 4 | 82.636364 |
| 1 | 6 | 122.285714 |
| 2 | 8 | 209.214286 |
Siuba is a tool for concise, flexible data-analysis over multiple data sources. It currently supports pandas DataFrames and SQL tables.
pip install --pre siubaThe code below uses the example DataFrame mtcars, to get the average horsepower (hp) per cylinder.
from siuba import _, group_by, summarize
from siuba.data import mtcars
(mtcars
>> group_by(_.cyl)
>> summarize(avg_hp = _.hp.mean())
)| cyl | avg_hp | |
|---|---|---|
| 0 | 4 | 82.636364 |
| 1 | 6 | 122.285714 |
| 2 | 8 | 209.214286 |
There are three key concepts in this example:
| concept | example | meaning |
|---|---|---|
| verb | group_by(...) |
a function that operates on a table, like a DataFrame or SQL table |
| lazy expression | _.hp.mean() |
an expression created with siuba._, that represents actions you want to perform |
| pipe | mtcars >> group_by(...) |
a syntax that allows you to chain verbs with the >> operator |
_)A siu expression is a way of specifying what action you want to perform. This allows siuba verbs to decide how to execute the action, depending on whether your data is a local DataFrame or remote table.
from siuba import _

_.cyl == 4
█─==
├─█─.
│ ├─_
│ └─'cyl'
└─4Notice how the output represents each step in our lazy expression, with these pieces:
==) or getting an attribute (.)._) - a placeholder for a table of data.We can use these expressions like lambda functions. For example, to keep specific rows of a pandas DataFrame.
# old approach: repeat name
mtcars[mtcars.cyl == 4]

# old approach: lambda
mtcars[lambda _: _.cyl == 4]

# siu approach
mtcars[_.cyl == 4]| mpg | cyl | disp | hp | drat | wt | qsec | vs | am | gear | carb | |
|---|---|---|---|---|---|---|---|---|---|---|---|
| 2 | 22.8 | 4 | 108.0 | 93 | 3.85 | 2.320 | 18.61 | 1 | 1 | 4 | 1 |
| 7 | 24.4 | 4 | 146.7 | 62 | 3.69 | 3.190 | 20.00 | 1 | 0 | 4 | 2 |
| ... | ... | ... | ... | ... | ... | ... | ... | ... | ... | ... | ... |
| 27 | 30.4 | 4 | 95.1 | 113 | 3.77 | 1.513 | 16.90 | 1 | 1 | 5 | 2 |
| 31 | 21.4 | 4 | 121.0 | 109 | 4.11 | 2.780 | 18.60 | 1 | 1 | 4 | 2 |
11 rows × 11 columns
Note that like the lambda function, siuba avoids typing the same (potentially_very_long) name twice, while also being a bit shorter.
Verbs are functions that operate on a table of data. They can be combined using a pipe with the >> operator.
from siuba import _, mutate, filter, group_by, summarize
from siuba.data import mtcarsThe previous example can be re-written in siuba as the following.
(mtcars
  >> group_by(_.cyl)
  >> mutate(demeaned = _.hp - _.hp.mean())
  )
(grouped data frame)
| mpg | cyl | disp | hp | drat | wt | qsec | vs | am | gear | carb | demeaned | |
|---|---|---|---|---|---|---|---|---|---|---|---|---|
| 0 | 21.0 | 6 | 160.0 | 110 | 3.90 | 2.620 | 16.46 | 0 | 1 | 4 | 4 | -12.285714 |
| 1 | 21.0 | 6 | 160.0 | 110 | 3.90 | 2.875 | 17.02 | 0 | 1 | 4 | 4 | -12.285714 |
| ... | ... | ... | ... | ... | ... | ... | ... | ... | ... | ... | ... | ... |
| 30 | 15.0 | 8 | 301.0 | 335 | 3.54 | 3.570 | 14.60 | 0 | 1 | 5 | 8 | 125.785714 |
| 31 | 21.4 | 4 | 121.0 | 109 | 4.11 | 2.780 | 18.60 | 1 | 1 | 4 | 2 | 26.363636 |
32 rows × 12 columns
Note that there is a key difference: mutate returned a pandas DataFrame with the new column (demeaned) at the end. This is a core feature of siuba verbs–tables in and tables out.
Below are examples of keeping certain rows with filter, and calculating a single number per group with summarize.
g_cyl = group_by(mtcars, _.cyl)

# keep lowest hp per group
g_cyl >> filter(_.hp == _.hp.min())
(grouped data frame)
| mpg | cyl | disp | hp | drat | wt | qsec | vs | am | gear | carb | |
|---|---|---|---|---|---|---|---|---|---|---|---|
| 5 | 18.1 | 6 | 225.0 | 105 | 2.76 | 3.460 | 20.22 | 1 | 0 | 3 | 1 |
| 18 | 30.4 | 4 | 75.7 | 52 | 4.93 | 1.615 | 18.52 | 1 | 1 | 4 | 2 |
| 21 | 15.5 | 8 | 318.0 | 150 | 2.76 | 3.520 | 16.87 | 0 | 0 | 3 | 2 |
| 22 | 15.2 | 8 | 304.0 | 150 | 3.15 | 3.435 | 17.30 | 0 | 0 | 3 | 2 |
g_cyl >> summarize(avg_hp = _.hp.mean())| cyl | avg_hp | |
|---|---|---|
| 0 | 4 | 82.636364 |
| 1 | 6 | 122.285714 |
| 2 | 8 | 209.214286 |
The verbs above received a few different calculations as arguments:
_.hp.mean()_.hp.min()You can use any methods from the underlying pandas objects as methods.
# outside
mtcars.shape[0] + 1

# inside mutate
mtcars >> mutate(res = _.shape[0] + 1)| mpg | cyl | disp | hp | drat | wt | qsec | vs | am | gear | carb | res | |
|---|---|---|---|---|---|---|---|---|---|---|---|---|
| 0 | 21.0 | 6 | 160.0 | 110 | 3.90 | 2.620 | 16.46 | 0 | 1 | 4 | 4 | 33 |
| 1 | 21.0 | 6 | 160.0 | 110 | 3.90 | 2.875 | 17.02 | 0 | 1 | 4 | 4 | 33 |
| ... | ... | ... | ... | ... | ... | ... | ... | ... | ... | ... | ... | ... |
| 30 | 15.0 | 8 | 301.0 | 335 | 3.54 | 3.570 | 14.60 | 0 | 1 | 5 | 8 | 33 |
| 31 | 21.4 | 4 | 121.0 | 109 | 4.11 | 2.780 | 18.60 | 1 | 1 | 4 | 2 | 33 |
32 rows × 12 columns
This includes the str and dt attribute accessor methods:
import pandas as pd

df = pd.DataFrame({"x": ["apple", "banana"]})

# outside
df.x.str.contains("a")

# inside mutate
df >> mutate(res = _.x.str.contains("a"))| x | res | |
|---|---|---|
| 0 | apple | True |
| 1 | banana | True |
Fortnuately, plotnine supports siuba’s style of piping, so is easy to plug in to!
from siuba import mutate, _
from plotnine import ggplot, aes, geom_point

(mtcars
  >> mutate(hp_per_cyl = _.hp / _.cyl)
  >> ggplot(aes("cyl", "hp_per_cyl"))
   + geom_point()
)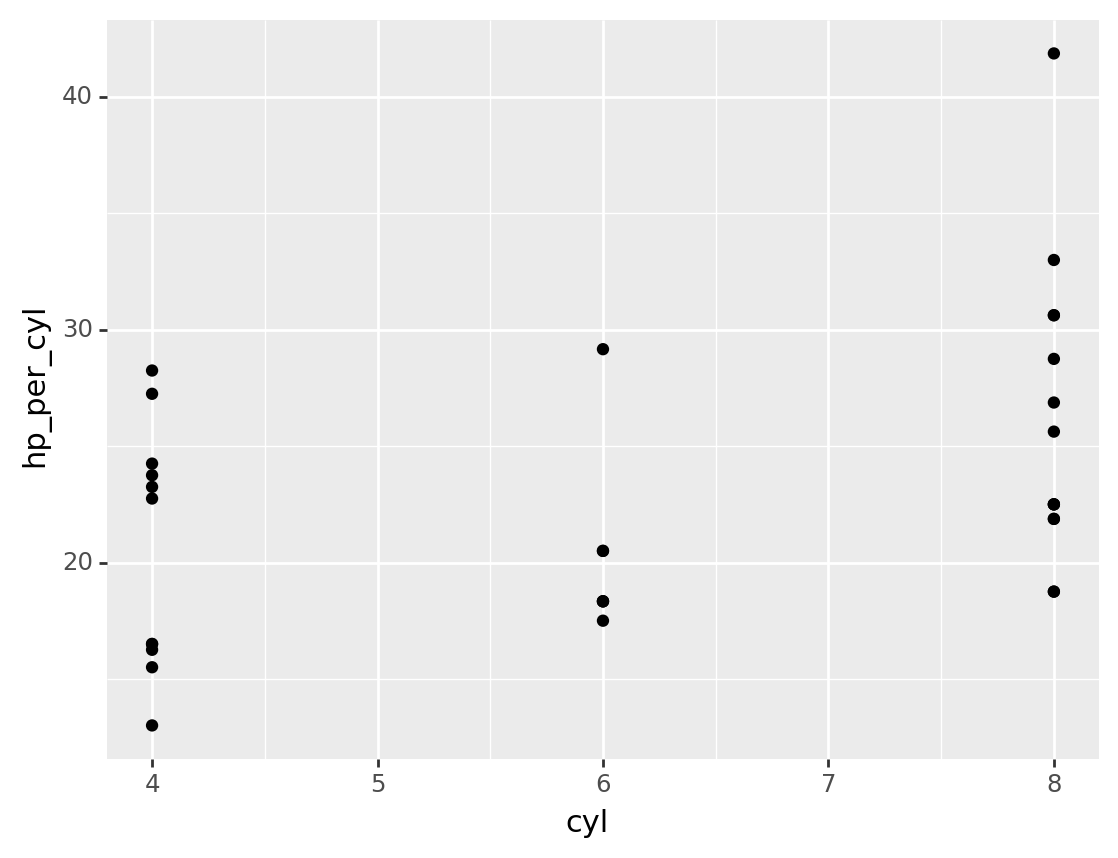
<ggplot: (8775643137660)>TODO