from setup import ___

from siuba import *
from plotnine import *

from music_top200 import music_top200, track_featuresAesthetics
Click here to open the slides full screen.
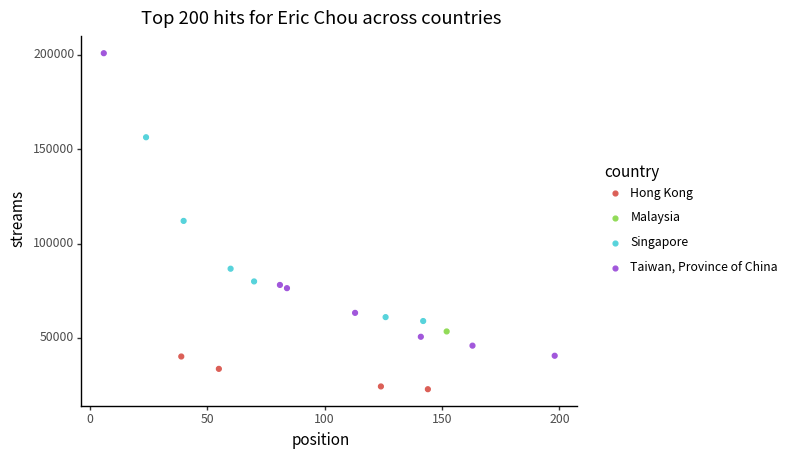
The plot below shows all top 200 hundred hits for Eric Chou across countries. Use the code cell below to recreate it.
(Note: running the code won’t delete the plot!).
# your code here


#
Expand the code cell below to see the solution.
Show solution
(music_top200
  >> filter(_.artist == "Eric Chou")
  >> ggplot(aes("position", "streams", color = "country"))
   + geom_point()
   + labs(title = "Top 200 hits for Eric Chou across countries")
)
Exercise 2:
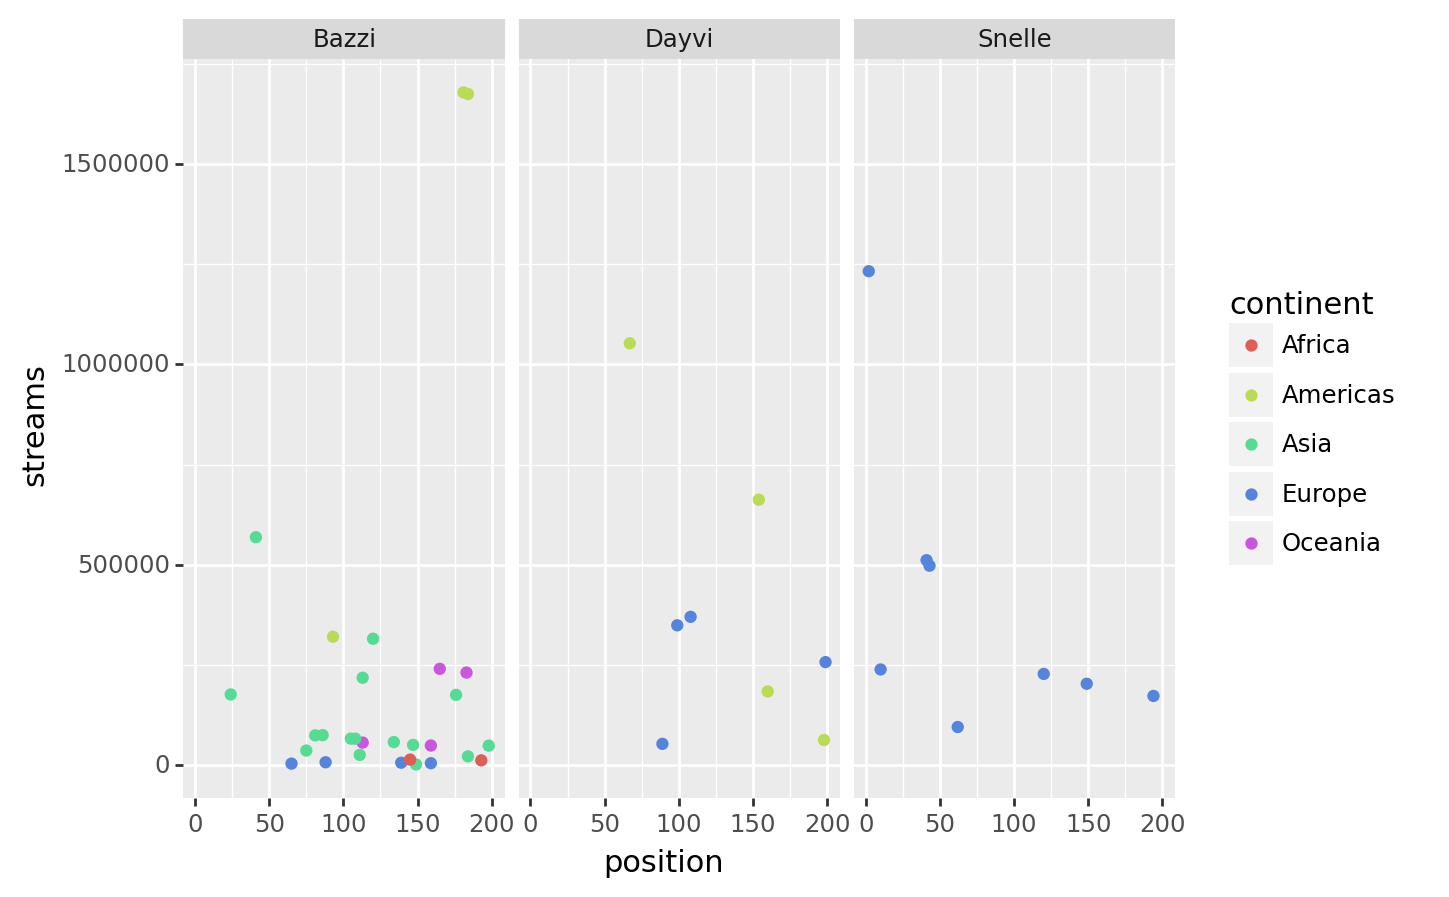
Use plots of the data for the artists Snelle, Bazzi, and Davyi, to answer the questions below.
You may need to write and run code multiple times, and produce multiple plots.
(

)
()
Show solution
p1 = (music_top200
  >> filter(_.artist.isin(["Snelle", "Bazzi", "Dayvi"]))
  >> ggplot(aes("position", "streams", color = "country"))
   + geom_point()
   + facet_wrap("~artist")
)

p2 = (music_top200
  >> filter(_.artist.isin(["Snelle", "Bazzi", "Dayvi"]))
  >> ggplot(aes("position", "streams", color = "continent"))
   + geom_point()
   + facet_wrap("~artist")
)

print(p1, p2)

Which of these artists have hit tracks in the most continents?
Snelle
Incorrect. Did you try using the color aesthetic?Bazzi
That’s right. Bazzi has hits on every continent.Dayvi
Incorrect. Did you try using the color aesthetic?How many countries does Dayvi have hit tracks in?